|
|
SHORT-RUN AGGREGATE SUPPLY CURVE: A graphical representation of the short-run relation between real production and the price level, holding all ceteris paribus aggregate supply determinants constant. The short-run aggregate supply, or SRAS, curve is one of two curves that graphical capture the supply-side of the aggregate market; the other is the long-run aggregate supply curve (LRAS). The demand-side of the aggregate market is occupied by the aggregate demand curve. The positive slope of the SRAS curve captures the direct relation between real production and the price level that exists in the short run.
Visit the GLOSS*arama
|
|


|

|
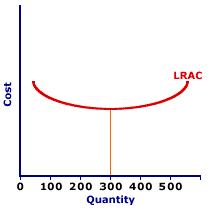
                           MINIMUM EFFICIENT SCALE: The quantity of production that places a firm at the lowest point on its long-run average cost curve. The minimum efficient scale achieves production of a good at the lowest possible opportunity cost. In other words, it is not possible to produced a good at any lower cost than at the minimum efficient scale. At this quantity the production involves foregoing the least amount of other goods. While minimum efficient scale is often specified in terms of "the quantity of production," it need not be a single quantity. It could be a range of output. The reason is that long-run average cost is subject to two influences, economies of scale (and increasing returns to scale) for small production levels and diseconomies of scale (and decreasing returns to scale) for larger production levels.The minimum efficient scale is the production quantity or range of quantities in which these two influences balance out. Or, another way of stating this, the minimum efficient scale is the production quantity or range of quantities in which the economies of scale have been exhausted, but the diseconomies of scale have not yet surfaced. This could be a single quantity, a turning point on the long-run average cost curve, or it could be a range of output. | Long-Run Average Cost Curve |  |
The exhibit to the right presents the long-run average cost curve for the production of Wacky Willy Stuffed Amigos (those cute and cuddly armadillos, tarantulas, and scorpions). The negatively-sloped range for relatively small quantities of output is the result of economies of scale. Over this range, workers and machinery become increasingly specialized, volume discounts are given on electricity prices, auxiliary activities begin springing up around the Wacky Willy factory, and markets are emerging for some of the bi-products.As the scale of production increases, these economies of scale are exhausted and diseconomies take hold. This is reflected in the positively-sloped portion of the long-run average cost curve. Diseconomies of scale result because the factory is so big, with so many workers and levels of management, that it is increasingly difficult to manage. Moreover, because The Wacky Willy Company is the primary employer in Shady Valley, labor prices rise as Wacky Willy employment increases. The minimum point on the long-run average cost curve occurs where economies of scale give way to diseconomies, and a production quantity of 300. This is the minimum efficient scale for the production of Wacky Willy Stuffed Amigos. As far as the opportunity cost of foregone production is concerned, Wacky Willy cannot produced Stuffed Amigos at a lower per unit cost than at this minimum efficient scale.

Recommended Citation:MINIMUM EFFICIENT SCALE, AmosWEB Encyclonomic WEB*pedia, http://www.AmosWEB.com, AmosWEB LLC, 2000-2024. [Accessed: May 4, 2024].
Check Out These Related Terms... | | | | | | |
Or For A Little Background... | | | | | | | | |
And For Further Study... | | | | | | | |
Search Again?
Back to the WEB*pedia
|


|

|
PINK FADFLY
[What's This?]
Today, you are likely to spend a great deal of time flipping through the yellow pages wanting to buy either a dozen high trajectory optic orange golf balls or a large red and white striped beach towel. Be on the lookout for a thesaurus filled with typos.
Your Complete Scope
This isn't me! What am I?
|

|
|
The 22.6% decline in stock prices on October 19, 1987 was larger than the infamous 12.8% decline on October 29, 1929.
|

|
|
"My father used to say to me, „Whenever you get into a jam, whenever you get into a crisis or an emergency . . .become the calmest person in the room and you'll be able to figure your way out of it. " -- Rudolph Giuliani
|

|
SSAP
Statement of Standard Accounting Practice
|

|
|
Tell us what you think about AmosWEB. Like what you see? Have suggestions for improvements? Let us know. Click the User Feedback link.
User Feedback
|


|


